FIGURE 1.
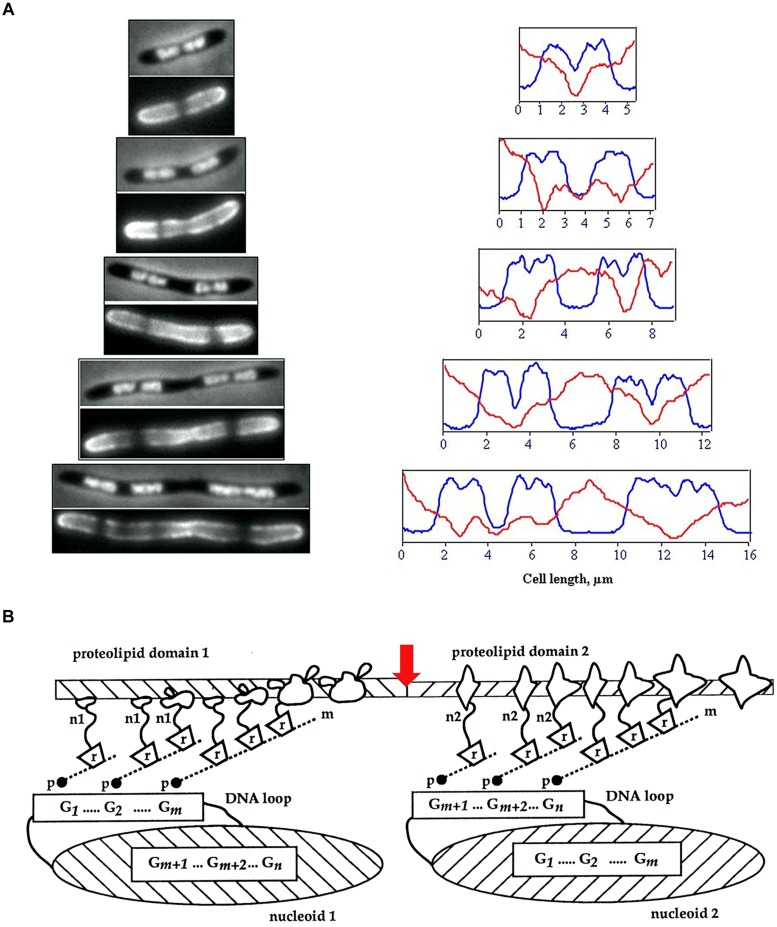
(A) Visualization of membrane heterogeneity in Escherichia coli cells by fluorescent microscopy. Left: image of an E. coli cell division mutant pbpB(ts) transferred to the non-permissive temperature (time zero, bacterium at the top), double-stained with DAPI (top half of image) and FM4-64 (bottom half of image) for visualization of nucleoids and membrane, respectively; adapted from Fishov and Woldringh (1999), © John Wiley and Sons. On the right, plots of fluorescence intensity profiles along filaments (DAPI, blue line; FM4-64, red). (B) The relationship between proteolipid domains, transertion, and clusters of genes either “looped out” from or buried within the nucleoid. n1, n2, nascent proteins; m, mRNA; r, ribosomes; p, RNA polymerase; G, gene clusters; red arrow indicates division site; adapted from Norris and Madsen (1995), © Elsevier.

