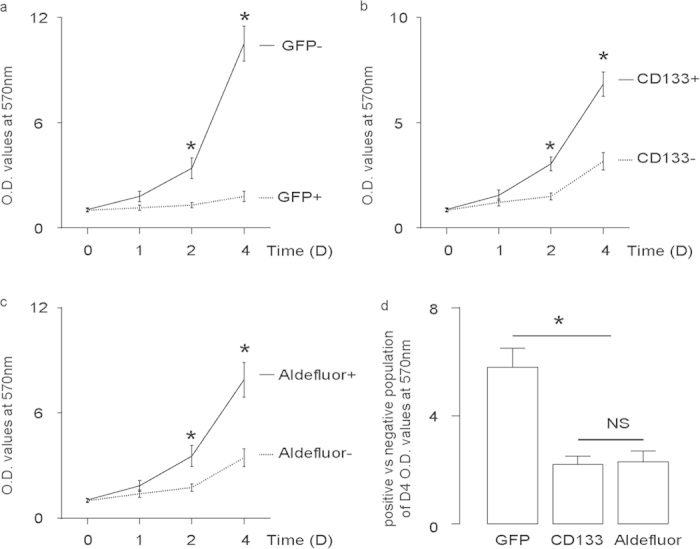
Figure 3. FoxO1-negative cells grew significantly faster than FoxO1-positive cells.

(a,d) FoxO1-negative cells vs FoxO1-positive cells (a), CD133-high vs CD133-low cells (b) and aldefluor-high vs aldefluor-low cells (c) were used in a MTT assay to examine cell growth. (d) The fold increase in growth of FoxO1-negative vs FoxO1-positive cells at D4 is significantly higher than CD133-high vs CD133-low cells, or aldefluor-high vs aldefluor-low cells. *p < 0.05. NS: non-significant. n = 5. Statistics: one-way ANOVA with a Bonferoni correction, followed by Fisher’s exact test.
