Figure 1.
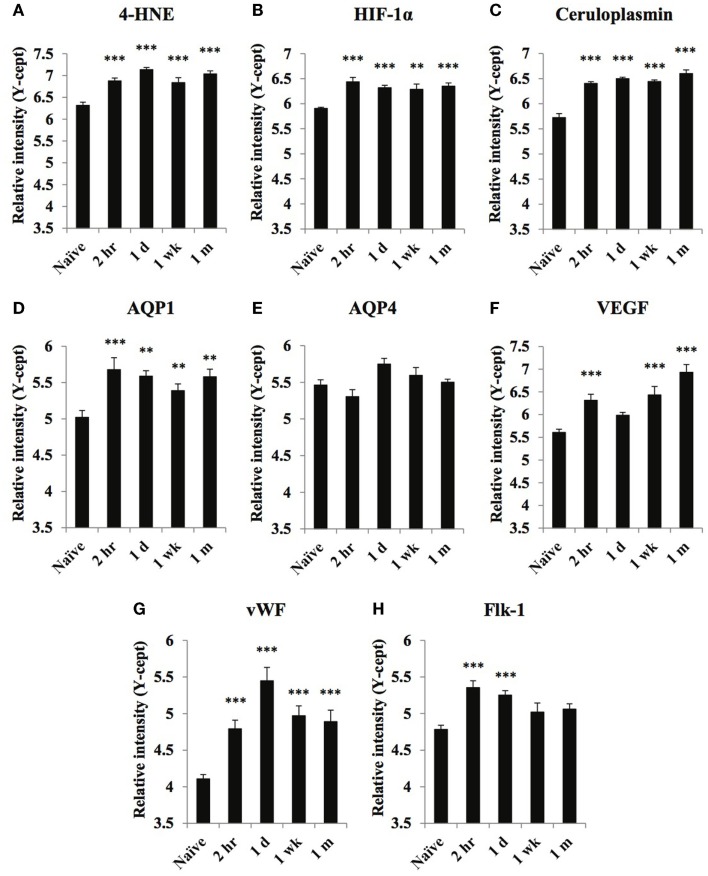
Temporal changes of select oxidative stress and vascular markers in serum obtained from naïve and at 2 h, 1 day, 1 week, and 1 month of post-blast over pressure exposed animals. Protein levels of oxidative stress markers 4-HNE (A), HIF-1α (B), ceruloplasmin (C), vascular related biomarkers AQP1 (D), AQP4 (E), VEGF (F), vWF (G), and FLK-1 (H) were assayed using reverse phase protein microarray (RPPM) and are expressed as y-cept values (log 10). Data are presented as the mean ± SEM; **p < 0.01, ***p < 0.001.

