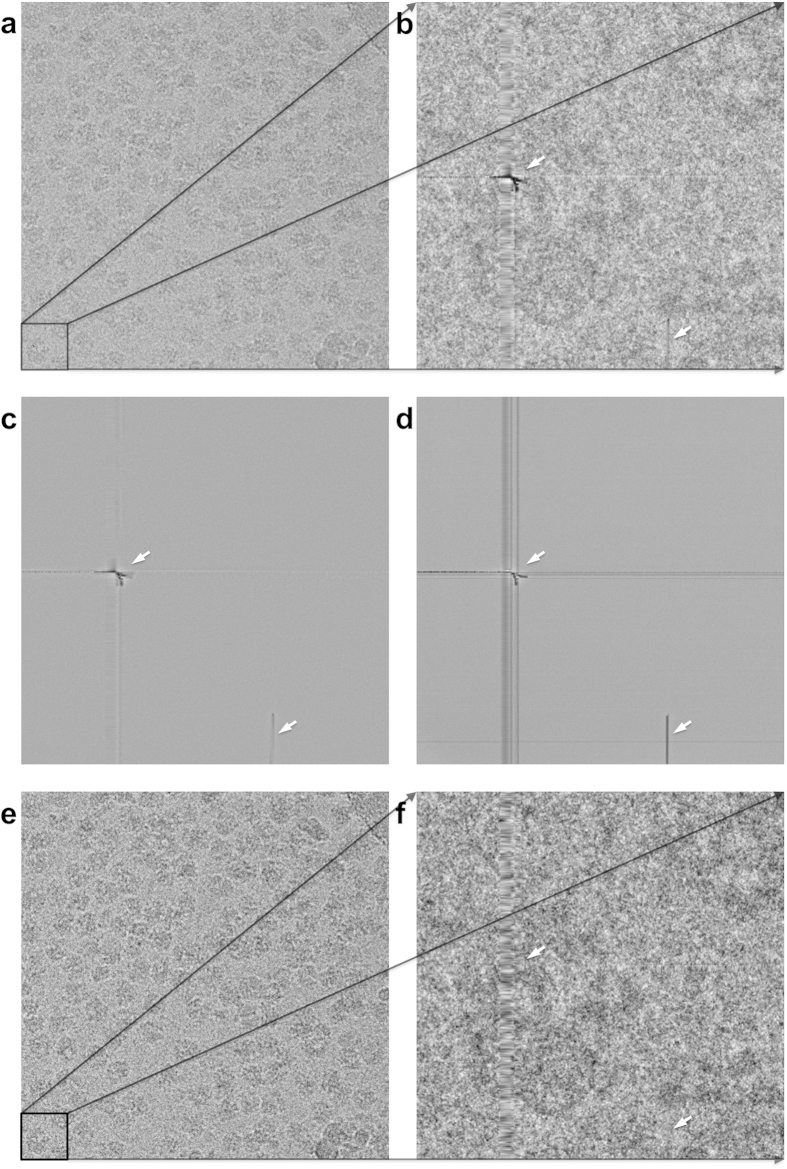
Figure 1.
One full raw 4096 × 4096 ribosome image (a), and one specific zoomed-in 512 × 512 patch (lower-left corner) extracted from that image (b). This patch was the worst patch we could find in this experimental 4096 × 4096 back-thinned CMOS direct electron detection camera. The chip errors are such that they can be visually pinpointed in the image in spite of the a priori correction of the data. The average of all corresponding patch images from the full dataset – a total of 10821 images - is shown in frame (c). Spurious vertical and horizontal lines and other serious “fixed pattern” defects become clearly visible, while the ribosome images disappear altogether due to the averaging. The corresponding patch in the σ-image (d) reveals a strong bundle of about 16 vertical lines (marked by the left arrow) that were well suppressed by the standard a priori correction. While this suppression apparently included the averaging of pixel information in the immediate vicinity of these “dead” pixels and lines, the sensitivity of these chip areas collapses as is revealed by the dark areas in the σ-image. Moreover, the σ-image also reveals a thin horizontal line at the bottom of the patch (lower arrow) that had been corrected out in the average image (c), but again without compensating for the gain anomalies generated by the defect. The a posteriori corrected images are shown in panels (e) and (f) derived from the images shown in panels (a) and (b), respectively. Interestingly the a posteriori correction managed to improve on the dataset even by visual criteria although the more relevant metric is the FRC (see Fig. 2). The amplitude spectra of the average and standard-deviation images are shown in the Supplementary Fig. S1.

