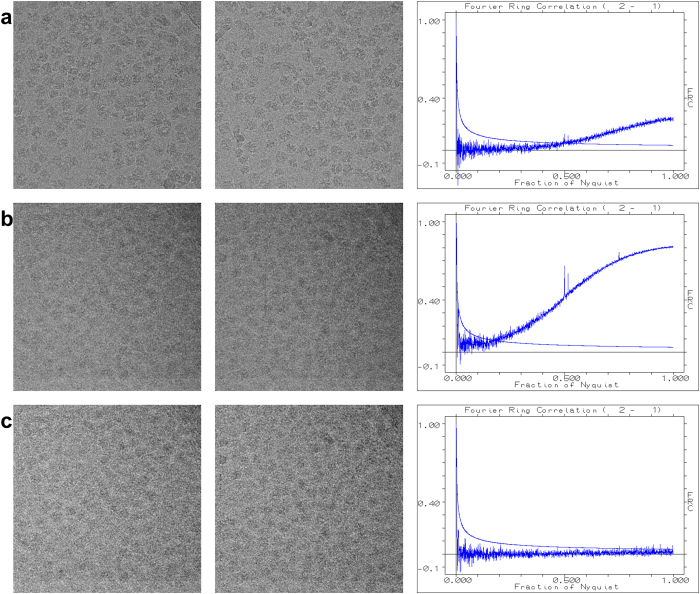
Figure 2.
(a) Two different images collected on the same sensor (dataset of Fig. 1) can show a strong correlation of the fine image details (high frequency Fourier space components) due to a common background pattern in the image transducer. The FRC curve shows that the high-frequency information fully exceeds (by more than 3σ) the level of expected random-noise correlations. (b) This effect can be exaggerated if we first average a number of raw input images to yield two image averages (12 different images per average are used here) and only then to perform the FRC calculations between these two average images. The extra peaks at 0.5 and 0.75 of the Nyquist frequency in the FRC curve, are associated with fixed sensor readout patterns of the on-chip electronics. (c) The FRC of the same averaged image-sets illustrates that after the a posteriori correction the systematic background pattern is virtually removed from the data. Note that, in this 12-fold exaggerated critical test, the correction of the residual sensor pattern is close-to perfect.

