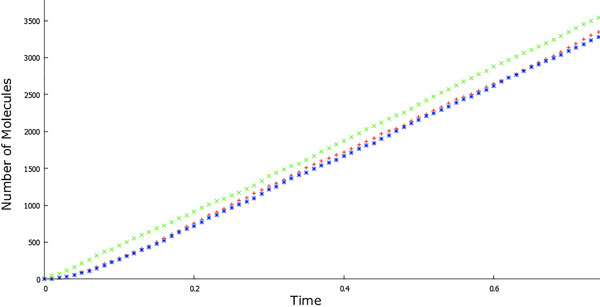
Figure 9.

Plots of number of product molecules vs. time obtained simulating a single-molecule reaction through a Markovian (green) or non-Markovian (red) single jump. The blue plot is obtained describing the corresponding full model. The parameters were taken from [13].
