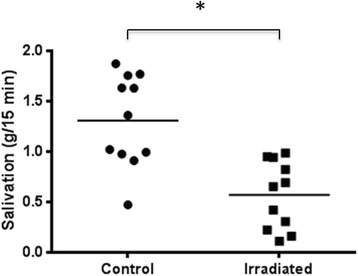
Fig. 2.

Salivation six weeks after 5 × 15 Gy radiotherapy. Salivation measured as grams saliva per 15 min in control (n = 11) and irradiated (n = 11) rats. The horizontal line indicates the mean values. *indicates p = 0.0004 by an unpaired, non-parametric Mann–Whitney test
