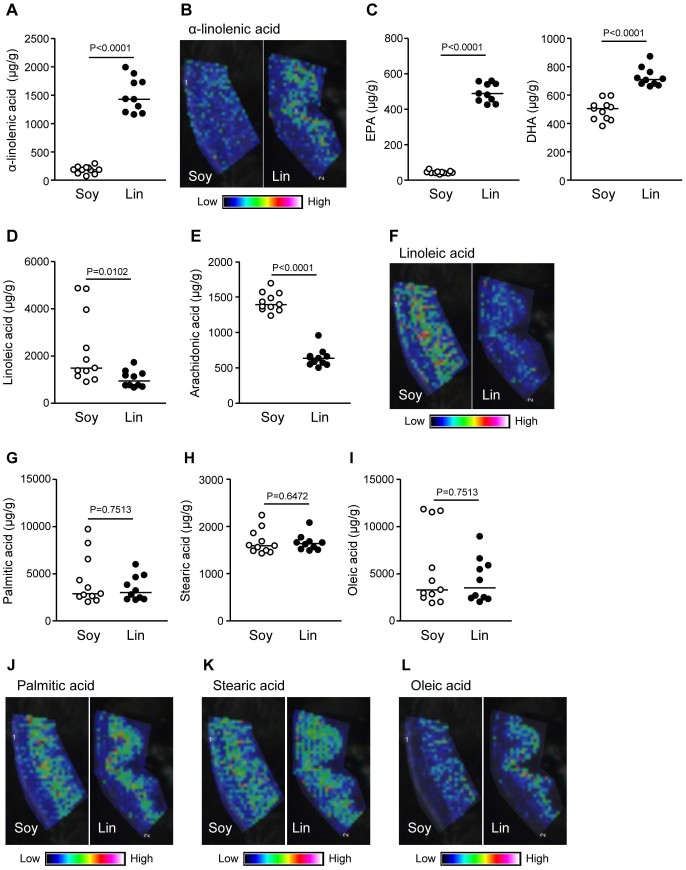
Figure 2. Fatty acid composition and distribution in the large intestines of mice receiving different dietary oils.
After two months of maintaining mice on diets containing 4% soybean (Soy) or linseed (Lin) oil, large intestines were collected for measuring α-linolenic acid (A), EPA and DHA (C), linoleic (D), arachidonic (E), palmitic (G), stearic (H), and oleic (I) acids by gas chromatography or for the detection of α-linolenic (B), arachidonic (F), palmitic (J), stearic (K), and oleic (L) acids by MALDI-IMS. Graphs show data from individual mice, and bars indicate median values. MALDI-IMS images are representative from three independent experiments.

