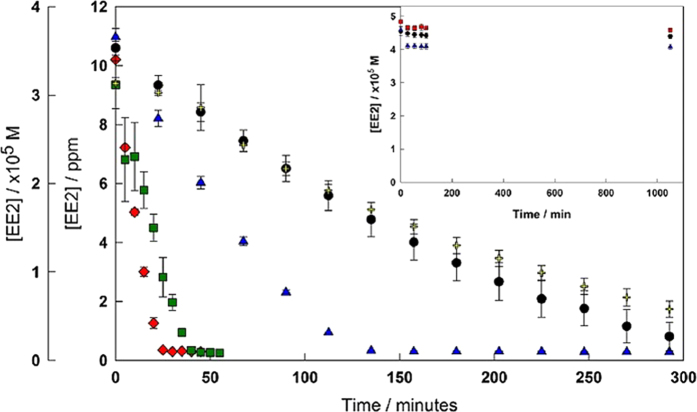
Figure 2. Degradation of EE2 under a variety of environmentally relevant conditions.
Graph: Degradation of EE2 at pH 7.5 (phosphate buffer, 0.01 M) with H2O2 (337 μM, 11.46 ppm) catalysed by 2 (10 nM, black circles), (25 nM, blue triangles), (34 nM, green squares), (80 nM, red diamonds) and catalysed by 1 (80 nM, yellow crosses). Inset: Concentration of EE2 with no catalyst and 50 equivalents of hydrogen peroxide. Conditions: [EE2] = 5×10⁻⁵ M (14 ppm), [H2O2] = 2.5×10⁻³ M (85 ppm), 0.01 M phosphate buffer at pH 6 (black circles), pH 7.5 (red squares), and pH 9 (blue triangles).

