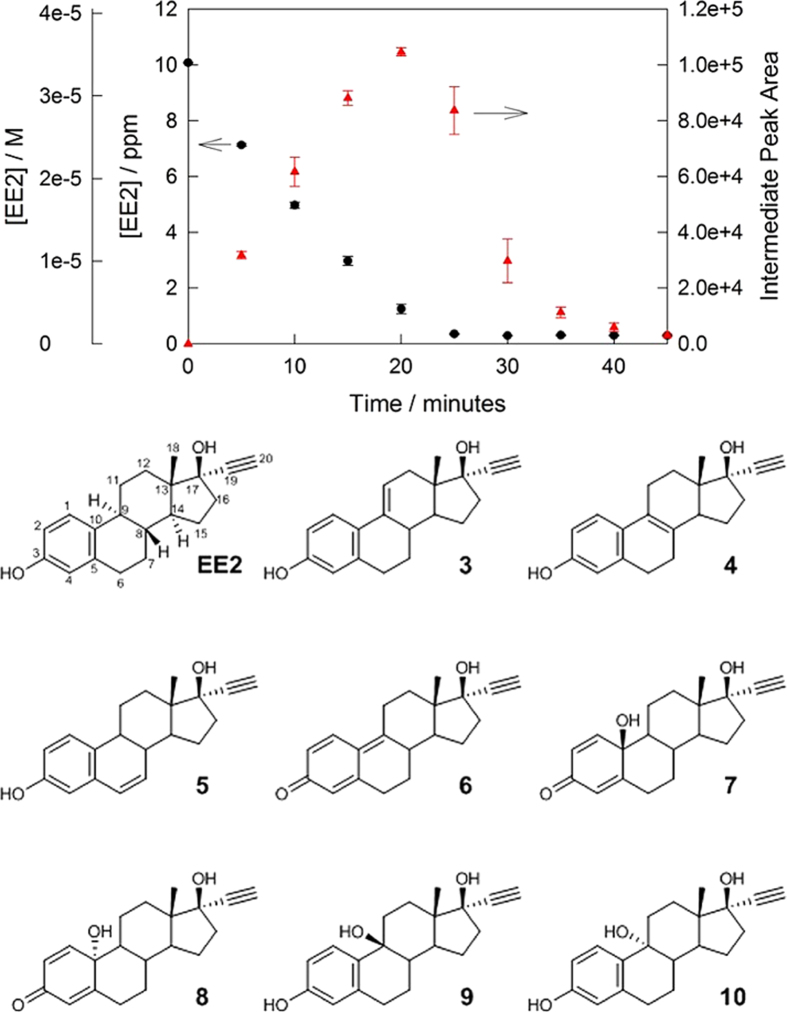
Figure 3. Typical degradation of EE2 with formation and subsequent degradation of intermediates.
Top: Decay of EE2 (10 ppm) with H2O2 (337 μM, 11.46 ppm) catalysed by 2 (80 nM, black) showing the combined formation and decay of three early degradation intermediates (red); pH 7.5 (phosphate buffer, 0.01 M). Bottom: Identified and likely EE2 degradation intermediates (also see Supplementary information).

