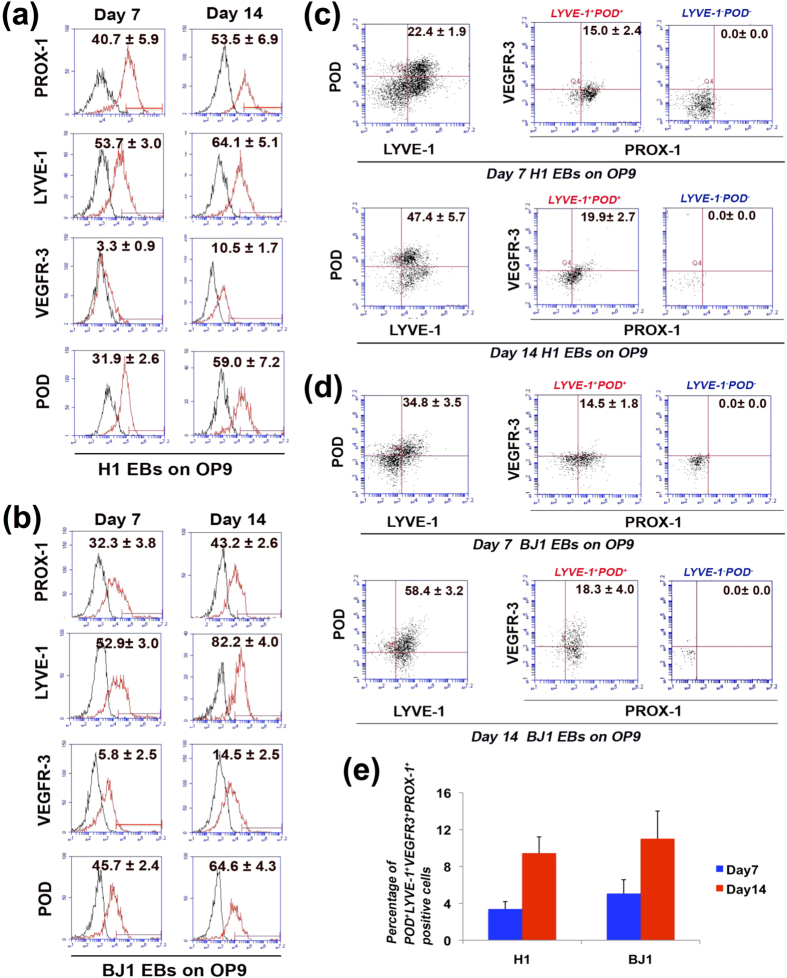
Figure 3. FACS analyses for multiple LEC marker expression in differentiated hESCs and hiPSCs.
FACS analyses were performed with H1 and BJ1 cells differentiated under the co-culture conditions for 7 and 14 days. (a, b) Single LEC marker staining for H1 (a) and BJ1 (b). (c, d) Quadruple staining with LEC markers for H1 (c) and BJ1 (d). LYVE-1+POD+and LYVE-1−POD−cells were re-plotted for both VEGFR-3 and PROX-1. (e) Bar graph for average percentage of differentiated H1 and BJ1 cells positive for four LEC markers. Number in each box of A through D represents percentage of positive cells of each indicated protein. N = 3, POD: PODOPLANIN.

