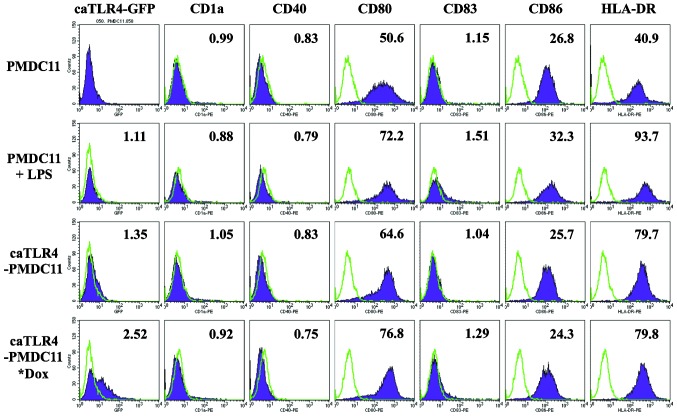
Figure 1.
Expression of antigen presentation-associated molecules in PMDC11 and caTLR4-PMDC11 cells. PMDC11, LPS-stimulated PMD11, caTLR4-PMDC11 and doxycycline-exposed caTLR4-PMD11 cells were analyzed for the expression of antigen presentation-associated molecules by flow cytometry. Histograms representative of three experiments are presented. PMDC11 and caTLR4-PMDC11 cells were treated with LPS (0.1 µg/ml) or doxycycline (1 µg/ml) for 24 h, respectively. Filled purple histograms represent staining with specific antibodies and open green histograms represent isotype-matched controls. Values in the graphs indicate mean fluorescence intensities. LPS, lipopolysaccharide; Dox, doxycycline; GFP, green fluorescent protein.

