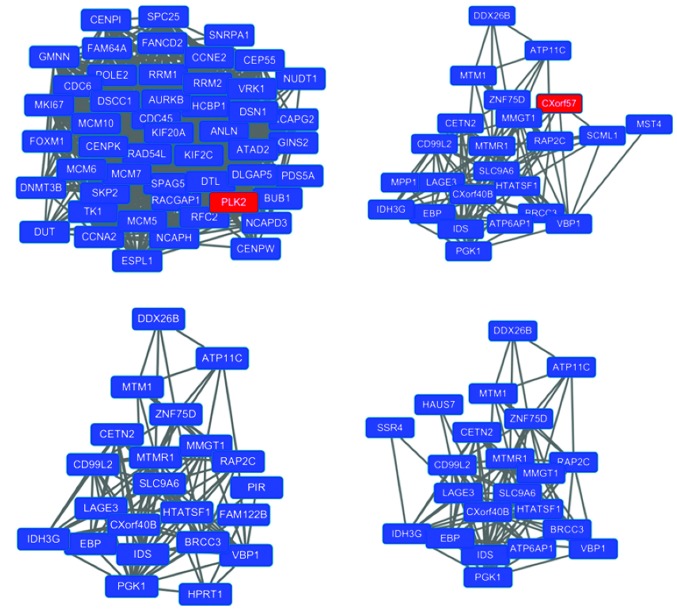
Figure 4.
Top four subnetworks extracted from the entire network, which were selected according to the p-value rank in the ClusterONE analysis. Upregulated genes are indicated in red and downregulated genes are indicated in blue. (A) subnetwork 1; (B) subnetwork 2; (C) subnetwork 3; (D) subnetwork 1. Links between the proteins indicate pairwise protein interactions.

