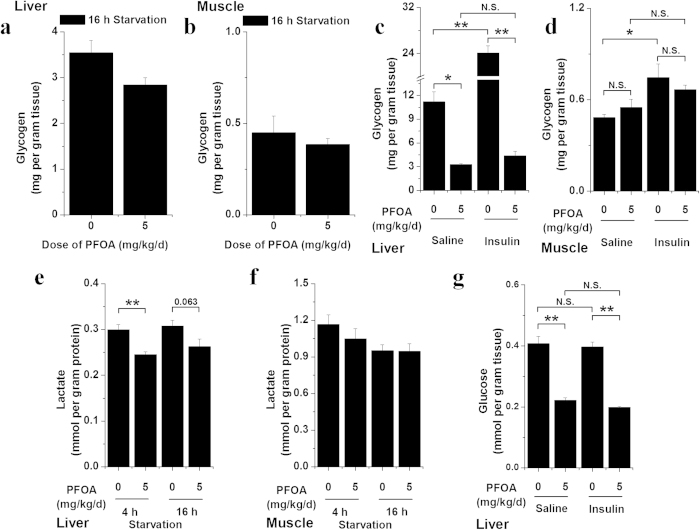
Figure 5. PFOA exposure disturbed glycogen metabolism in mice.
(a) Glycogen content in livers of mice dosed with 5 mg/kg/d PFOA after 16 h starvation (n = 5). (b) Glycogen content in muscles of mice dosed with 5 mg/kg/d PFOA after 16 h starvation (n = 5). (c) Glycogen content in livers of mice dosed with 5 mg/kg/d PFOA and treated with saline or insulin after 4 h starvation (n = 5). (d) Glycogen content in muscles of mice dosed with 5 mg/kg/d PFOA and treated with saline or insulin after 4 h starvation (n = 5). (e) Lactic acid content in livers of mice dosed with 5 mg/kg/d PFOA after 4 or 16 h starvation (n = 5). (f) Lactic acid content in muscles of mice dosed with 5 mg/kg/d PFOA after 4 or 16 h starvation (n = 5). Data are means ± SE. Significantly different from control group (*p < 0.05, **p < 0.01, N.S., not significant).

