
Figure 7. Interlaboratory reproducibility .
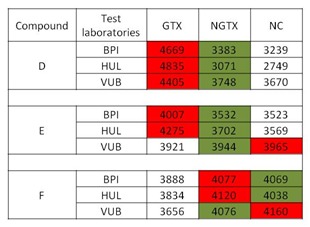
Results among three laboratories of three blindly tested compounds denoted as D, E and F using ANOVA approach. Red indicates the highest probability of a compound to belong to a specific class (e.g. GTX, NGTX, NC), whereas green indicates the lowest probability that a compound could be classified in the respective group. The experiments were performed in triplicate. (BPI, Biopredic International; GTX, genotoxic, HUL, University Hospital of Valencia; NC, non-carcinogens; NGTX, non-genotoxic; VUB, Vrije Universiteit Brussel)