
Figure 2. Fusion of GFP to NEP results in substantial attenuation.
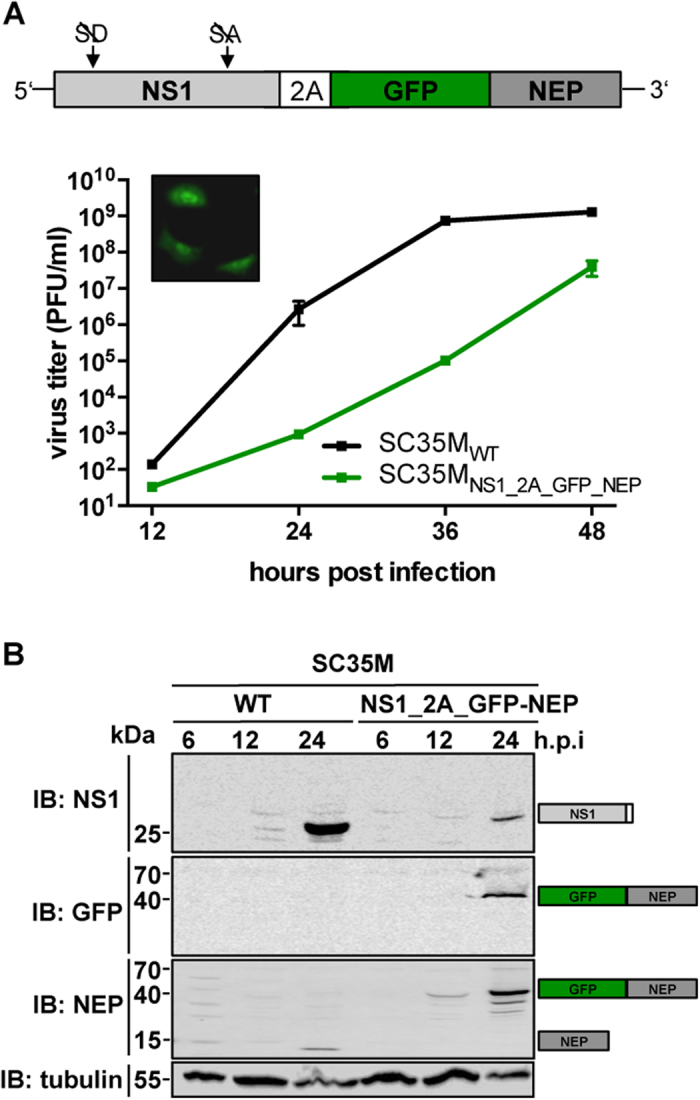
(A) Viral growth of SC35MWT and SC35MNS1_2A_GFP-NEP in MDCK-II cells. Viral titers in the supernatant of cells infected at an MOI of 0.001 were determined by plaque assay at the indicated time points. Error bars represent standard error of the mean from three independent experiments. The cartoon illustrates the design of the NS1_2A_GFP-NEP segment. The confocal microscopy image in the upper left corner shows GFP-positive A549 cells infected at an MOI of 5 with SC35MNS1_2A_GFP-NEP 6 hours post infection. (B) Immunoblot (IB) analysis of expression levels of NS1, NEP and GFP in A549 cells infected with SC35MWT or SC35MNS1_2A_GFP-NEP at an MOI of 0.1 at the indicated time points. Proteins corresponding to the size of the detected bands are indicated.