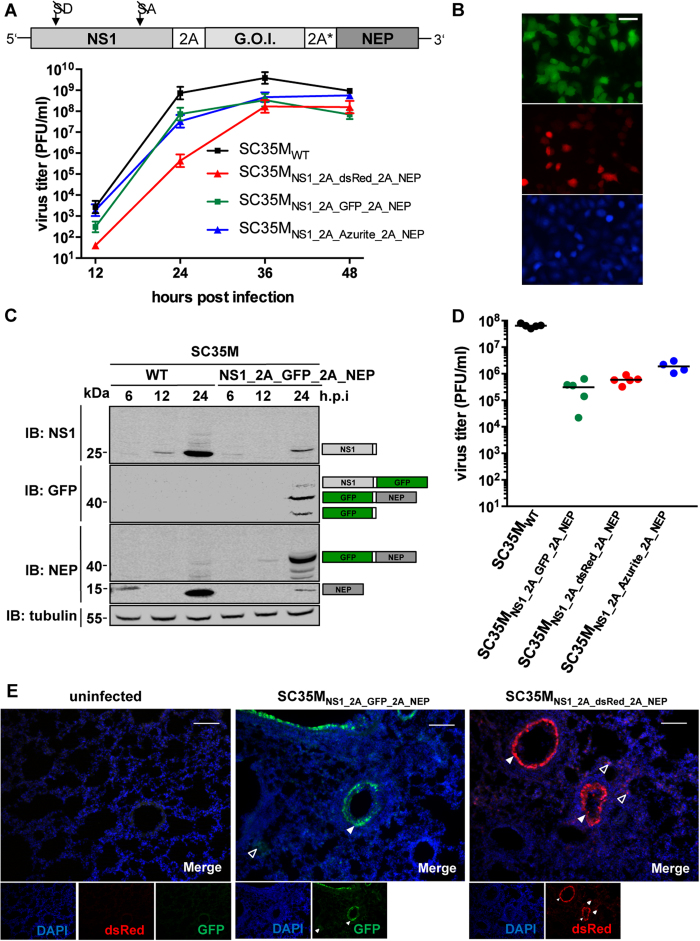
Figure 3. Insertion of a second PTV-1 2A peptide enhances replication of fluorescent reporter viruses.
(A) Viral growth of SC35MWT and the indicated fluorescent reporter viruses in MDCK-II cells. Viral titers in the supernatant of cells infected at an MOI of 0.001 were determined by plaque assay at the indicated time points post infection. Error bars represent standard error of the mean from three independent experiments. The cartoon is a schematic representation of the modified NS segment. A genetically altered sequence encoding a second PTV-1 2A peptide (2A*) was inserted between the gene of interest (G.O.I.) and NEP. (B) Fluorescent live cell imaging of A549 cells infected at an MOI of 1 with SC35MNS1_2A_GFP_2A_NEP (upper panel), SC35MNS1_2A_dsRed_2A_NEP (middle panel) or SC35MNS1_2A_Azurite_2A_NEP. Scale bar represents 100 μm. (C) Immunoblot (IB) analysis of expression levels of NS1, NEP and GFP in A549 cells infected with SC35MWT or SC35MNS1_2A_GFP_2A_NEP at an MOI of 0.1 at the indicated time points post infection. Proteins corresponding to the size of the detected bands are indicated. (D) Determination of lung titers from 6–8 week old female BALB/c mice (n = 4 or 5) infected intranasally with 1,000 PFU of the indicated viruses 48 hours post infection. (E) Fluorescent imaging of lung sections from BALB/c mice infected intranasally with 10,000 PFU of the indicated viruses or mock infection respectively. Lungs were collected 48 hours post infection. Filled arrowheads indicate infected cells within the epithelial layers of larger airways, whereas transparent arrowheads indicate infected cells of smaller airways. Scale bars represent 100 μm.

