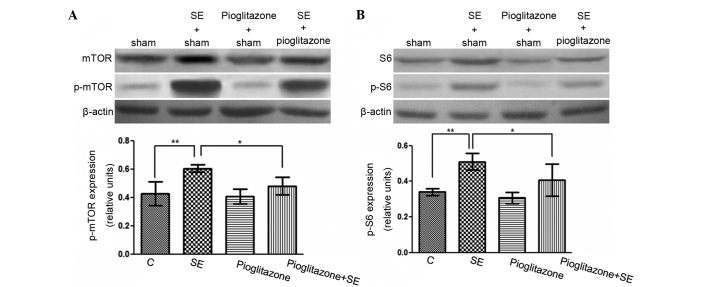
Figure 5.
Effects of pioglitazone on the protein expression of mTOR signaling in the hippocampus of SE rats. (A) Representative images and quantitative analysis of the ratio of p-mTOR/mTOR. (B) Representative images and quantitative analysis of the ratio of p-S6/S6. Data are expressed as the mean ± standard deviation. *P<0.05 and **P<0.01. C, control; SE, status epilepticus; p-mTOR, phosphorylated mammalian target of rapamycin.

