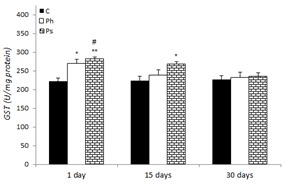
Figure 5. Effect of acute and chronic physical and psychological stresses on liver GST activity in control and stressed rats. Control (C), physical (Ph) and psychological (Ps) stresses. Values are expressed as mean ± SEM of 12 rats. *p<0.05 and **p<0.01 vs. day 1 in the control group; #P<0.01 vs. days 15 and 30 in the control group.