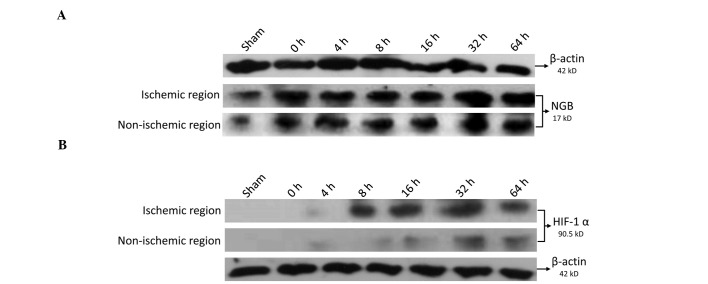
Figure 6.
HIF-1α and NGB protein expression levels in ischemic and non-ischemic regions, as determined by western blot analysis. (A) NGB protein expression level in the treatment and sham groups. (B) HIF-1α protein expression level in the treatment and sham groups. HIF, hypoxia inducible factor; NGB, neuroglobin.

