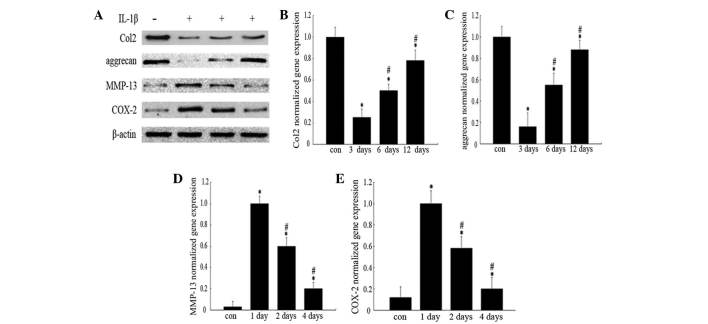
Figure 2.
Effects of IL-1β on protein and gene expression levels. The groups represent chondrocytes without treatment (con) and chondrocytes cultured with normal medium for either 3, 6 or 12 days (for analysis of Col2 and aggrecan) or for 1, 2 or 4 days (for COX-2 and MMP-13 analysis) following incubation with 10 ng/ml IL-1β for 24 h, respectively. (A) Protein expression was analyzed by western blotting and the blot shown is representative of typical results (three repeats completed). Gene expression levels of (B) Col2, (C) aggrecan, (D) COX-2 and (E) MMP-13 were analyzed by RT-qPCR. Histograms represent the mean of values relative to the maximum value. RT-qPCR analyses were run in triplicate and the results are presented as the mean ± standard deviation. *P<0.05 vs. control group; #P<0.05 vs. 3/1 day group. IL-1β, interleukin-1β; Col2, type II collagen; COX-2, cyclooxygenase-2; MMP-13, matrix metalloproteinase-13; RT-qPCR, reverse transcription-quantitative polymerase chain reaction.

