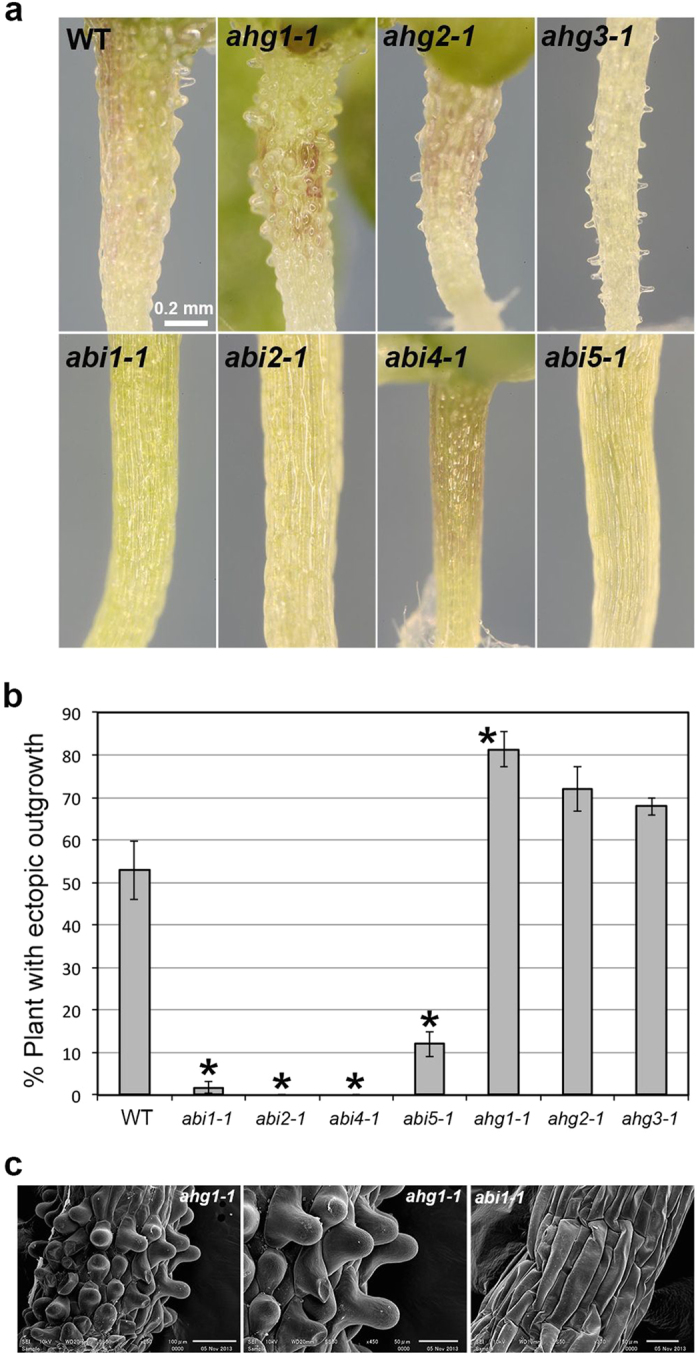
Figure 3. Effect of ABA on the morphology of hypocotyl epidermal cells in ABA-related mutants.

(a) Morphology of hypocotyls in the wild type (WT) and ABA-related mutants grown for 3 weeks in the presence of 1 μM ABA (ABA). The abi mutants showed the suppression of ectopic outgrowth whereas the ahg mutants showed enhanced outgrowth. (b) Quantification of ectopic outgrowth in the wild type (WT), abi mutants and ahg mutants. Data are displayed as averages ± SEM of 3 independent experiments. Asterisks indicate significant differences from the value in the wild type (P < 0.001) according to Fisher’s exact probability test in abi1, abi2 and abi4 and according to the chi-square test for the difference between two proportions in abi5, ahg1, ahg2 and ahg3 (abi1-1, P = 1.7 × 10⁻¹⁴; abi2-1, P = 1.4 × 10⁻¹⁴; abi4-1, P = 2.7 × 10⁻¹⁶; abi5-1, P = 5.0 × 10⁻⁸; ahg1-1, P = 3.9 × 10⁻⁶; ahg2-1, P = 0.0027; ahg3-1, P = 0.034). (c) SEM images of hypocotyls of ahg1-1 and abi1-1 grown for 3 weeks in the presence of 1 μM ABA.
