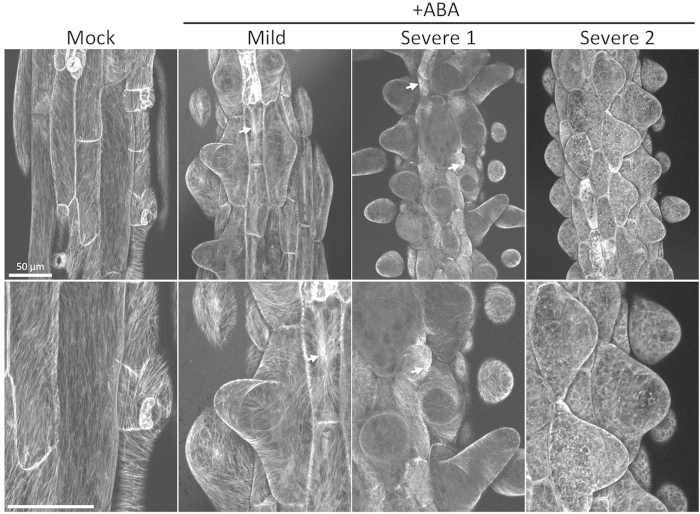
Figure 5. Effect of ABA on cortical microtubules.
Z-stack images of hypocotyl epidermal cells in GFP-TUB6 plants grown for 2 weeks on medium without (Mock) or with 1 μM ABA (+ABA). The phenotypes were divided into two groups: mild plants (Mild) and severe plants (Severe 1 and 2). “Severe 2” indicates very severe phenotype. Lower panels are enlarged images of upper panels. Arrows indicate microtubule bundling.

