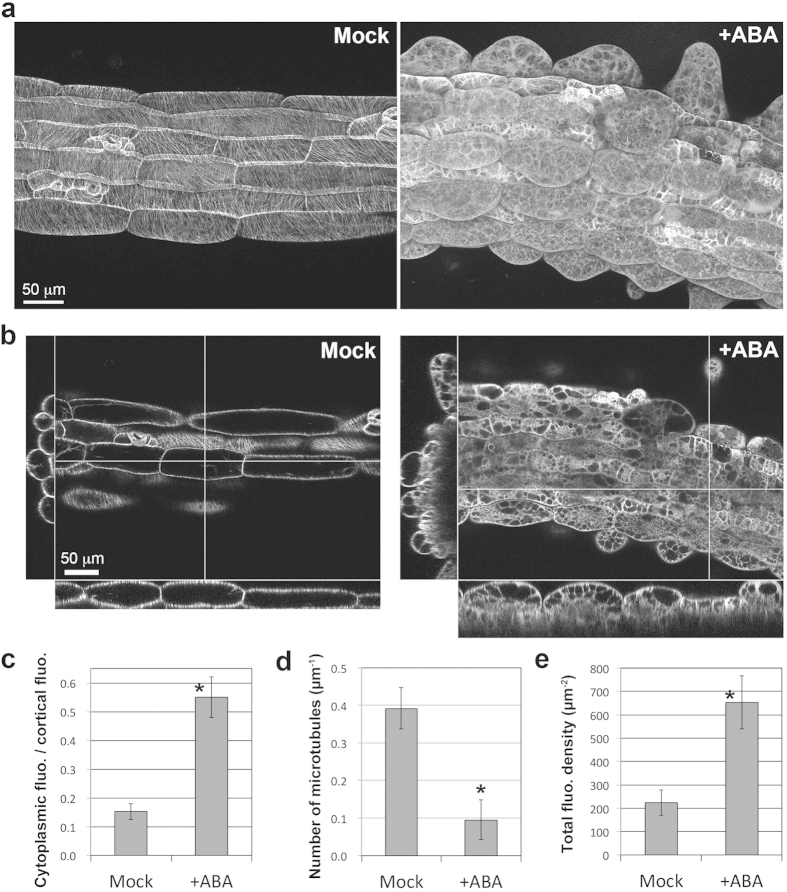
Figure 6. ABA-induced depolymerization of cortical microtubules.
(a) Z-stack images of hypocotyl epidermal cells of GFP-TUB6 plants grown for 2 weeks on medium without (Mock) or with 1 μM ABA (+ABA). This ABA-treated plant showed severe phenotype and extensive cortical microtubule depolymerization. (b) Orthogonal images along the optical axis (x, y) and xy-plane. (c) Quantification of the ratio of GFP-TUB6 fluorescence in the cortical region to the fluorescence in the cytoplasm in non-stoma cell files. Data are displayed as averages ± SD (n = 10 cells from 3 plants). (d) Quantification of the number of cortical microtubules without (Mock) or with 1 μM ABA (+ABA). Data are displayed as averages ± SD (n = 24 cells from 5 plants). (e) Quantification of the total fluorescence density of GFP-TUB6 without (Mock) or with 1 μM ABA (+ABA). Data are displayed as averages ± SD (n = 10 cells from 3 plants). Asterisks in (c), (d) and (e) indicate significant differences from the values in the mock treatment (Mann-Whitney U test, P = 0.0000054 in (c), P = 1.4 × 10⁻⁹ in (d), P = 0.0000054 in (e)).

