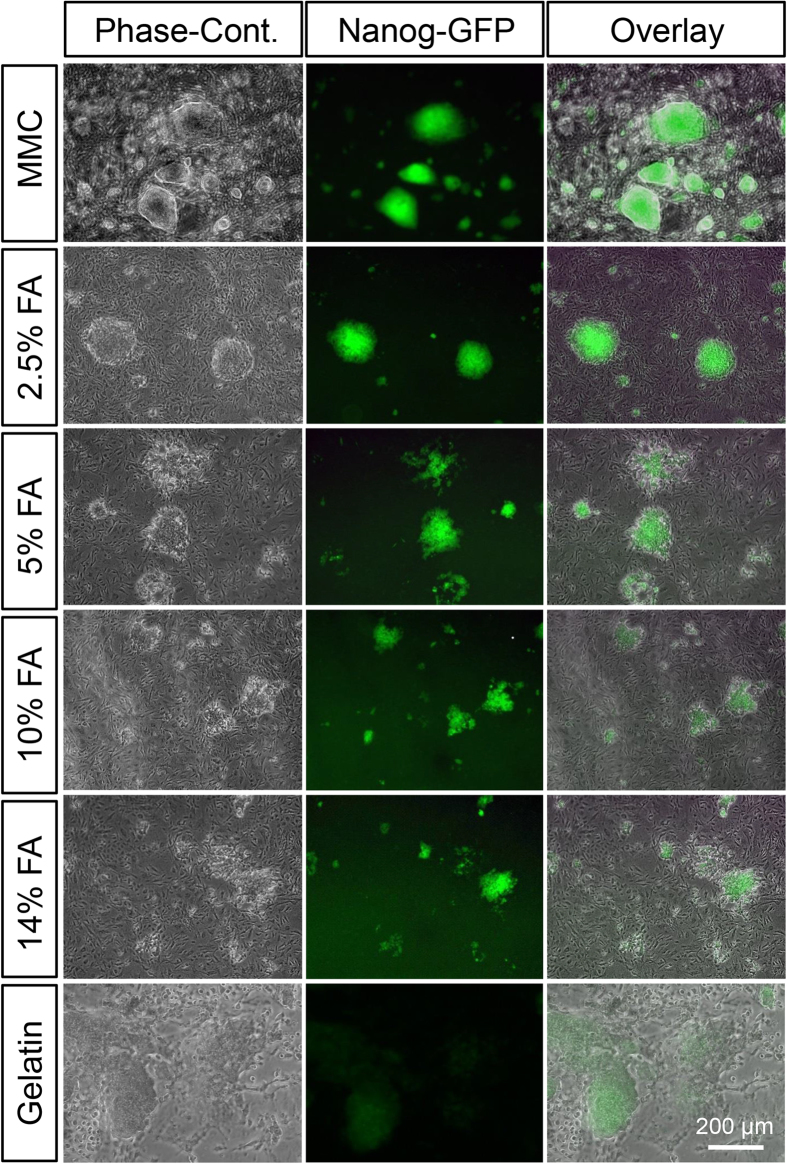
Figure 3. Morphology and Nanog-GFP expression of miPS cells cultured on MMC-treated MEFs, 2.5–14% FA-fixed MEFs, or gelatin-coated surfaces.
Green indicates Nanog-GFP expression. MMC: MEFs treated with 10 μg/mL MMC for 3 h; 2.5–14% FA: MEFs fixed with 2.5–14% FA for 10 min; Gelatin: miPS cells cultured on gelatin-coated dishes without feeder cells.

