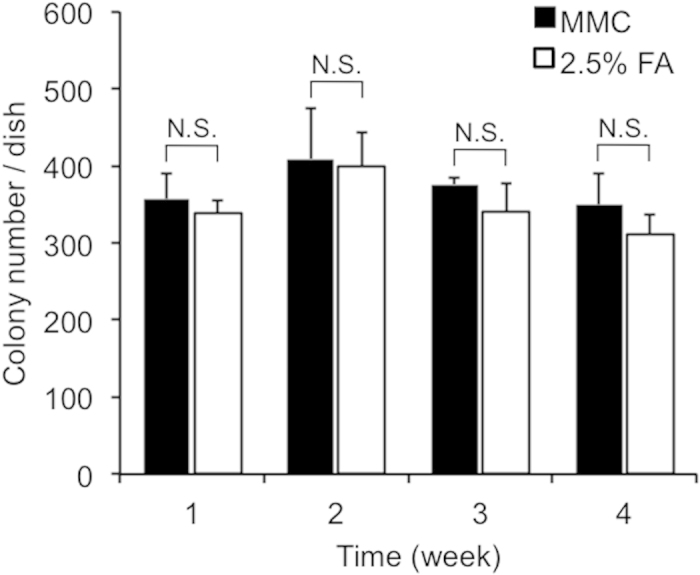
Figure 7. Colony formation of miPS cells on MMC-treated and 2.5% FA-fixed MEFs. All colonies were counted in the dishes.

Values are the means ± SD, n = 3. N.S., no significant difference, p < 0.05.

Values are the means ± SD, n = 3. N.S., no significant difference, p < 0.05.