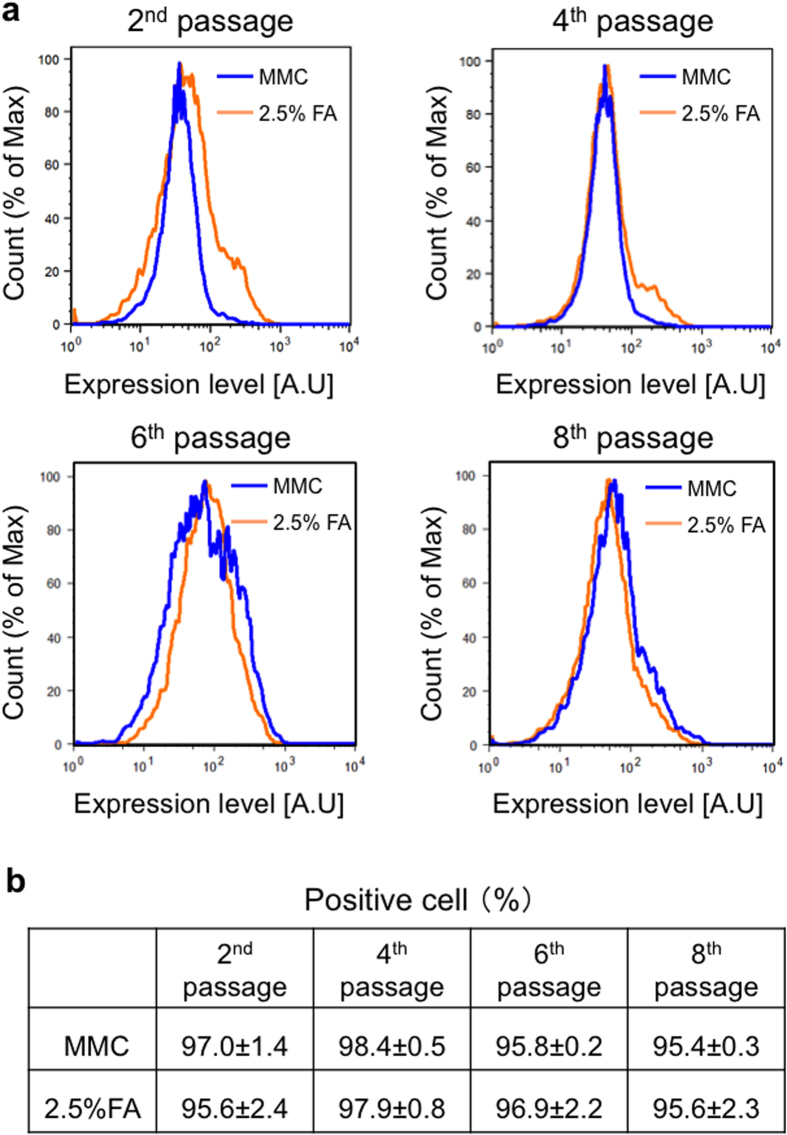
Figure 9. Flow cytometric analysis of miPS.
(a) Flow cytometric analysis of Oct3/4expression in miPS cells cultured on MMC-treated MEFs (blue lines) and 2.5% FA-fixed MEFs (orange lines) at 2nd, 4th, 6th, and 8th passages. (b) The frequency of Oct3/4-positive miPS cells. Values are the means ± SD, n = 3.

