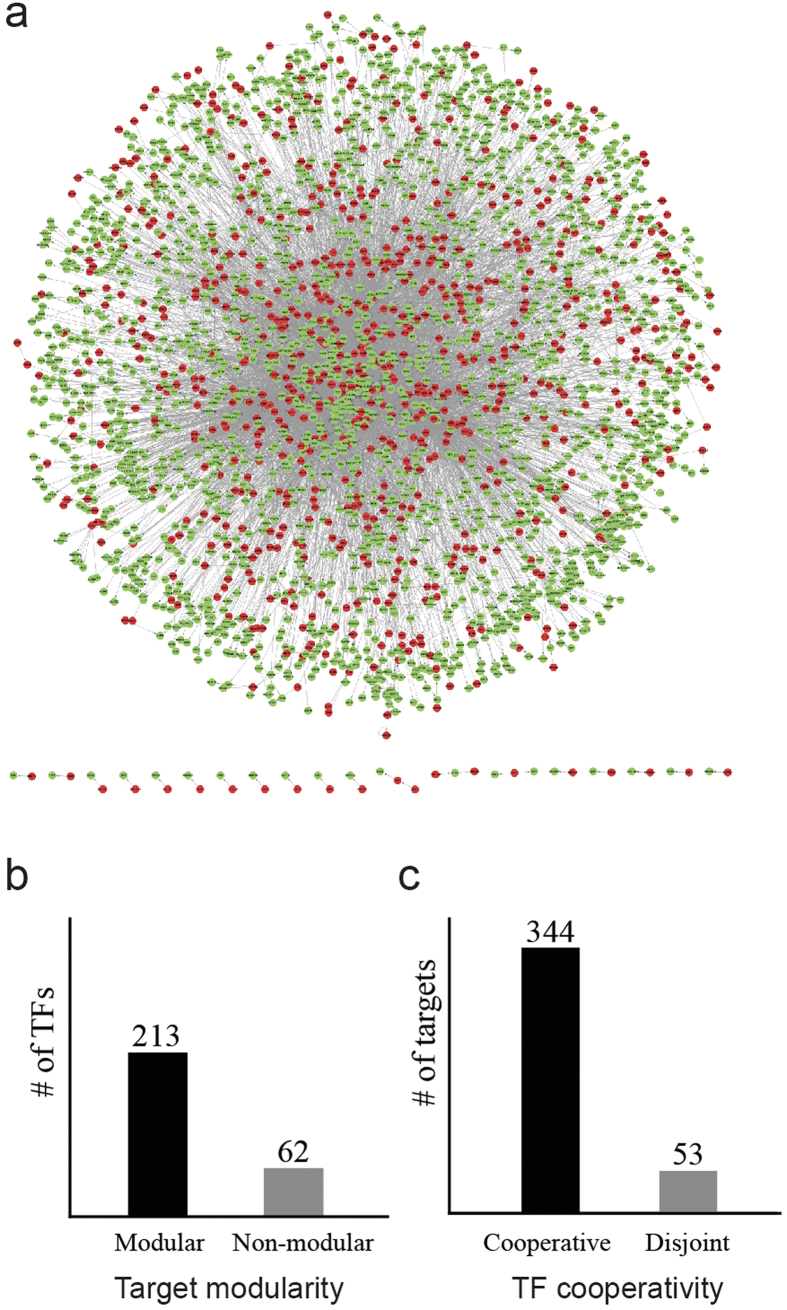
Figure 2.
(a) A network of TF (red nodes) and non-TF genes (green nodes) based on the regulatory interactions from TRRUST is shown. (b) Bar graphs show the number of TFs for two classes based on the different modularity of their targets. Only TFs with more than five target genes were considered for this analysis, resulting in 213 TFs with modular targets and 62 TFs with non-modular targets. (c) Bar graphs show the number of target genes for two classes based on the different cooperativity of their TFs. Only target genes regulated by more than five TFs were considered for this analysis, resulting in 344 target genes regulated by cooperative TFs and 53 target genes regulated by disjoint TFs.

