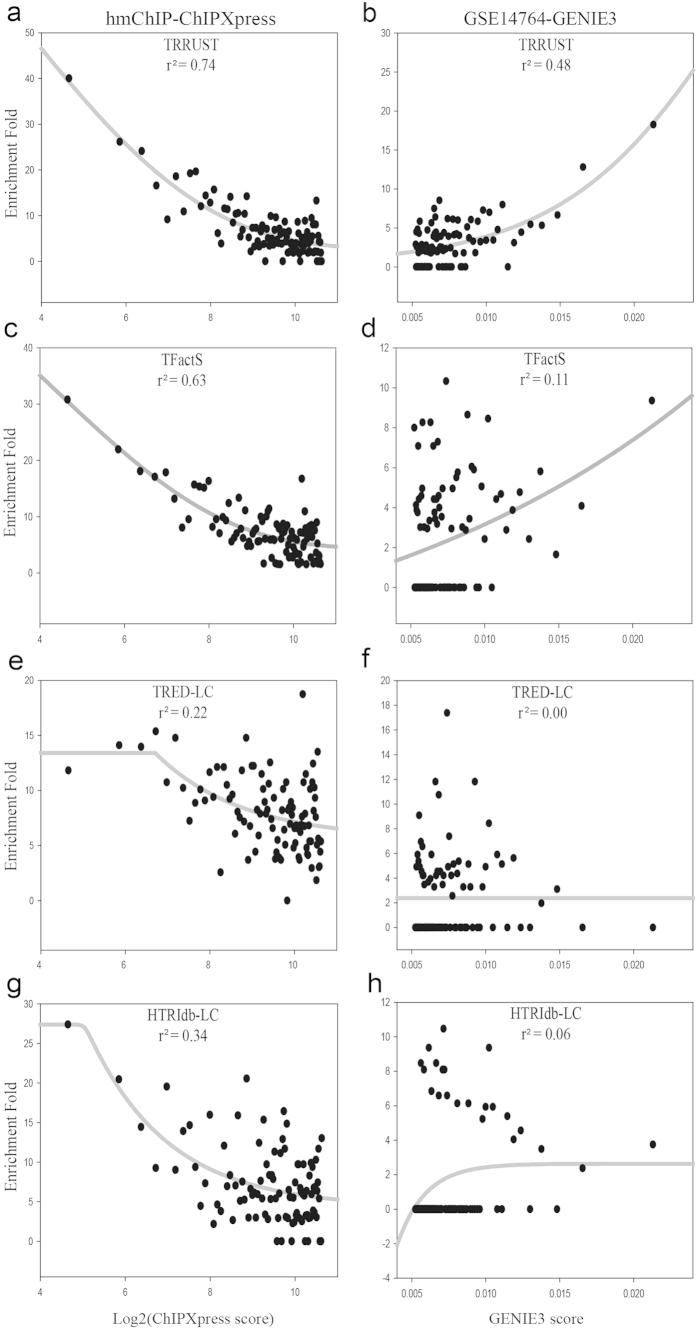
Figure 4.
Scatter plots representing the relationship between scores from algorithms (x-axis) and the enrichment fold for TRRUST (a,b), TFactS (c,d), TRED-LC (e,f) and HTRIdb-LC (g,h) gene pairs (y-axis) for inferred human TRNs are shown. TF-target interactions inferred from ChIP-chip/seq data of hmChIP database were scored by the ChIPXpress algorithm (a) and those from a series of microarray samples from the Gene Expression Omnibus database (GSE14764) were scored by the GENIE3 algorithm (b). The enrichment fold was measured for each of successive bins of 1,000 links, which were sorted by algorithm scores. We found best regressions between algorithm scores and the enrichment of benchmarking TF-target interactions using a sigmoidal curve fit for all tested databases. TRRUST exhibits substantially better correlation for the hmChIP-ChIPXpress (Fig. 4a, r2 = 0.74) and GSE14764-GENIE3 (Fig. 4b, r2 = 0.48) TRNs than the other databases (Fig. 4c–h). We used the most significant 100,000 TF-target interactions for all benchmarking analyses, and computed the logarithm of the original ChIPEXpress score due to the highly biased score distribution for the low score range.

