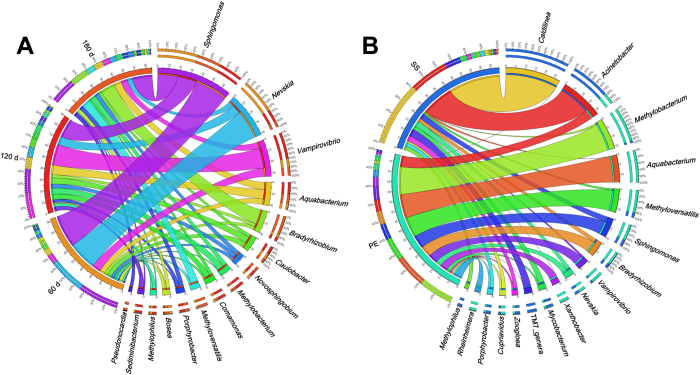
Figure 3.
Top 10 most abundant genera in the 60, 120, and 180 d (A), and the PE and SS (B) biofilm samples. The left segments represent the DW biofilm samples, and the right segments represent the top 10 genera in each biofilm. In the inner layer, each different colour represents a different sample or genus, and the numbers beside the axis indicate the relative abundances of the corresponding samples or genera. The width of the ribbons connecting the sample and genus segments indicates the relative abundances of the corresponding genera in the accordant biofilm samples. In the outer layer of the arc for the sample segments, the different colours represent the top 10 most abundant genera in each sample, with the percentages of reads presented in descending order. For the genus segments, the outer layer illustrates the distribution of the specific genera in each DW biofilm sample.

