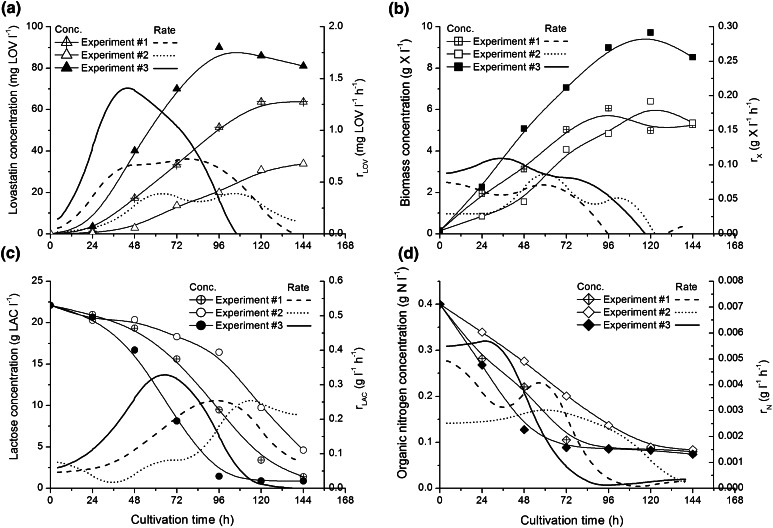
Fig. 1.
Changes of lovastatin (a), biomass (b), lactose (c) and organic nitrogen (d) concentrations in time in experiments from #1 to #3 with varied pellet diameter; linear graphs present lovastatin r LOV and biomass r X volumetric formation rates and lactose r LAC and organic nitrogen r N volumetric uptake rates

