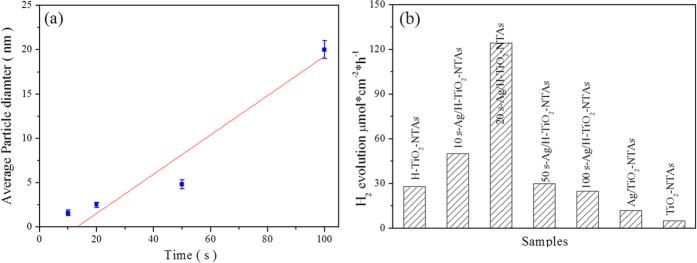
Figure 7. Size of Ag QDs and photocatalytic H2 production.

(a) The size of Ag quantum dots via the pulse electron-deposition time; (b) the hydrogen evolution rate by using various samples as photoanodes and Pt foil as cathodes, at 0.7 vs. SCE in a PEC cell containing a 2 M ethylene glycol and 0.5 M Na2SO4 solution under 300 W Xe lamp (>420 nm filter) irradiation.
