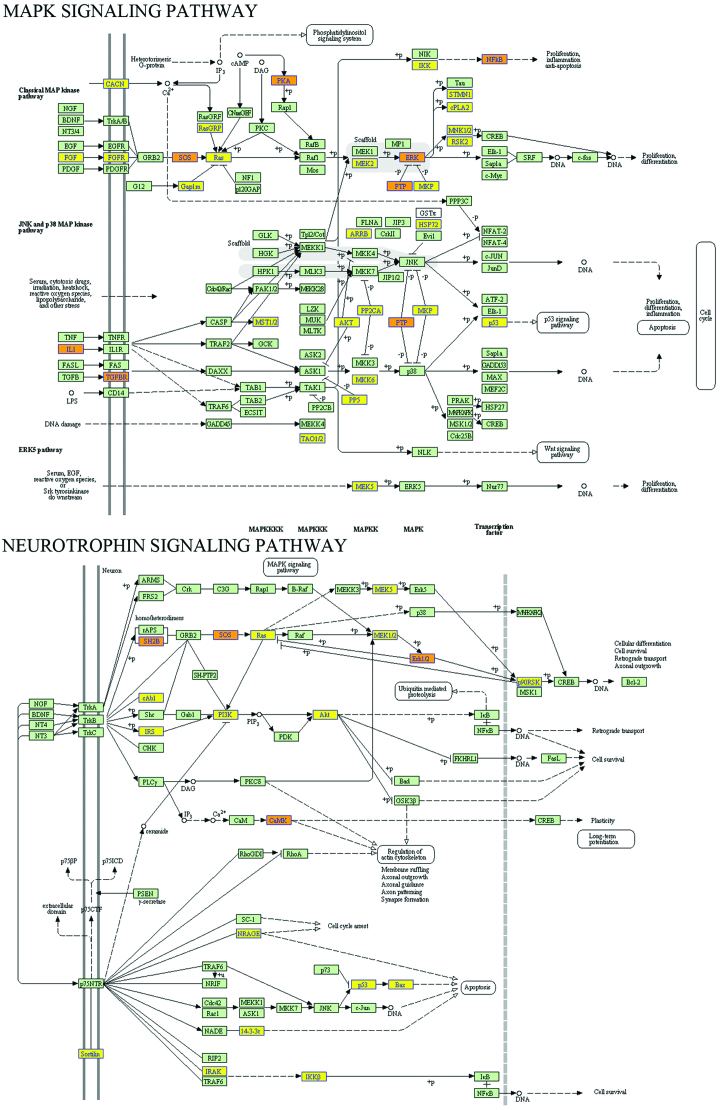
Figure 5.
MAPK signaling pathway and neurotrophin signaling pathway maps. The yellow nodes are associated with downregulated genes and the orange nodes are associated with upregulated or only whole dataset genes. The green nodes indicate no significant change in expression.. MAPK, mitogen-activated protein kinase.

