
Figure 6.
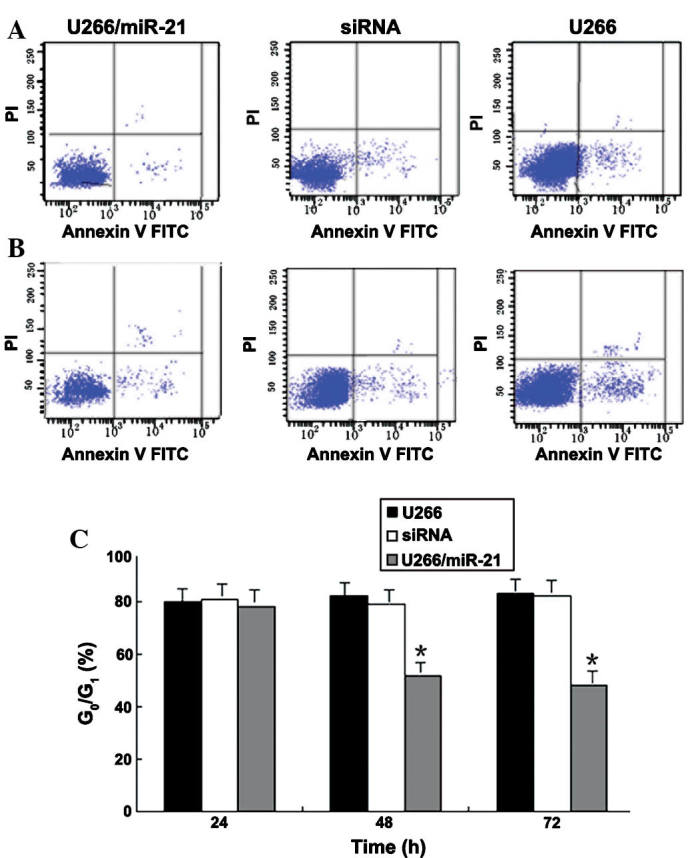
Assessment of U266 cell apoptosis by flow cytometry. (A and B) Dot plots of PI/Annexin V-FITC double stained cells at (A) 48 and (B) 72 h after transfection, showing apoptotic cells in the bottom right window. (C) Cells in G0/G1 phase in each group. *P<0.05, compared with the siRNA and U266 groups. PI, propidium iodide; FITC, fluorescein isothiocyanate; siRNA, small interfering RNA; miRNA, microRNA.