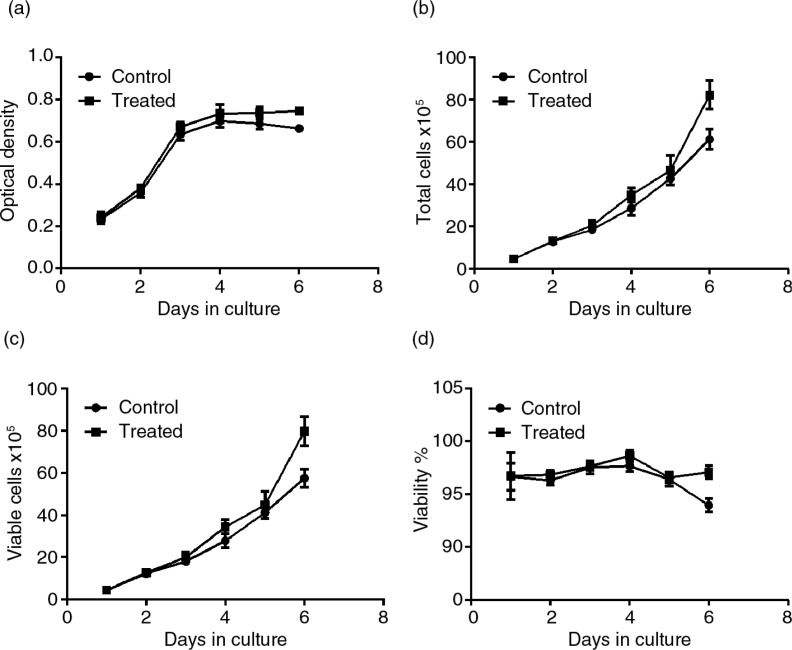
Fig. 3.
Effects of PSPA on RPE cell growth curve and viability. RPE cells without PSPA treatment were defined as the control; the effect of PSPA on the RPE cell growth curve and viability was evaluated at a dose of 100 µg/ml. (a) The growth curve of each group, expressed as optical density. Total cells, viable cells, and viability of each group were shown in b, c, and d, respectively (n=3).

