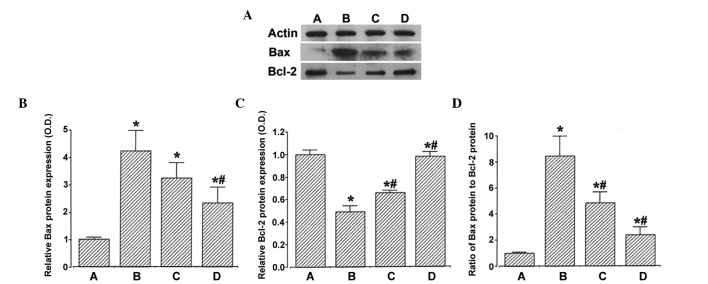
Figure 3.
Effects of ulinastatin on the expression levels of Bax and Bcl-2 in the hippocampus. (A) Expression levels of Bax and Bcl-2, detected using western blot analysis. (B) Relative expression of Bax. (C) Relative expression of Bcl-2. (D) Ratio of Bax to Bcl-2. (A) Sham-operation, (B) ischemia-induction, (C) ischemia and 50,000 units ulinastatin, (D) ischemia and 100,000 unitsulinastatin. Data are presented as the mean ± standard error of the mean. *P<0.05, compared with the sham-operation group; #P<0.05, compared with the ischemia-induction group. Blc-2, B cell lymphoma 2; Bax, Bcl-2-associated X protein; OD, optical density.

