
. 2015 May 7;12(2):2668–2676. doi: 10.3892/mmr.2015.3752
Copyright © 2015, Spandidos Publications
This is an open-access article licensed under a Creative Commons Attribution-NonCommercial 3.0 Unported License. The article may be redistributed, reproduced, and reused for non-commercial purposes, provided the original source is properly cited.
Figure 1.
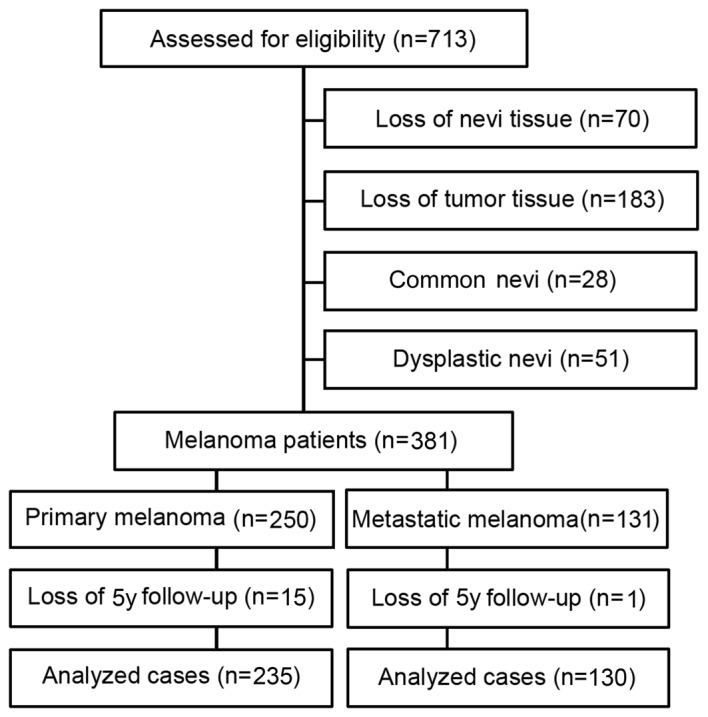
Diagram of patient inclusion and exclusion.