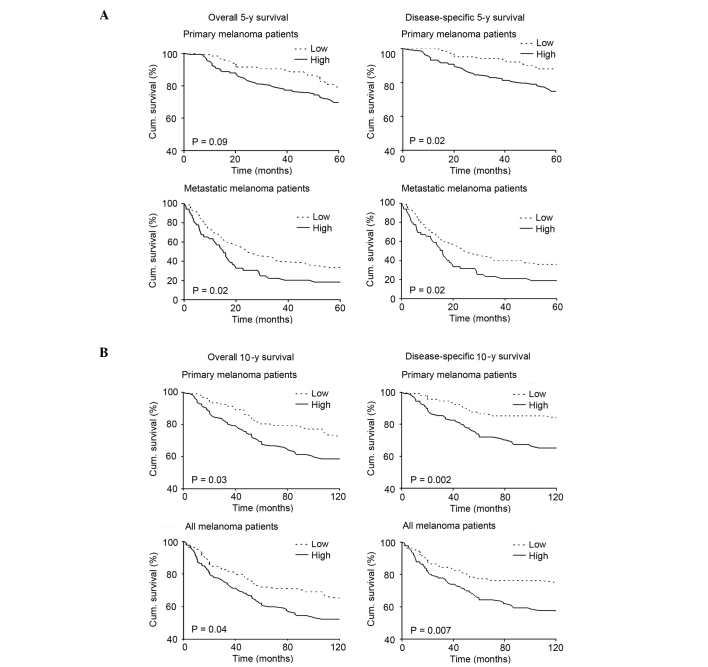
Figure 4.
Kaplan-Meier analysis of the correlation between NRP1 expression, and 5-year survival and 10-year survival. (A) Upper lane: Overall and disease-specific 5-year survival of patients with primary melanoma (n=235; P=0.09 and P=0.02 respectively; log-rank test). Lower lane: Overall and disease-specific 5-year survival of patients with metastatic melanoma (n=130; P=0.02 for each; log-rank test). Labels at the top of the figure apply to all graphs in the same column. (B) Upper lane: Overall and disease-specific 10-year survival of patients with primary melanoma (n=202; P=0.03 and P=0.002 respectively; log-rank test). Lower lane: Overall and disease-specific 10-year survival of all melanoma patients (n=235; P=0.04 and P=0.007 respectively; log-rank test). Labels at the top of the figure apply to all graphs in the same column. NRP1, neuropilin 1.

