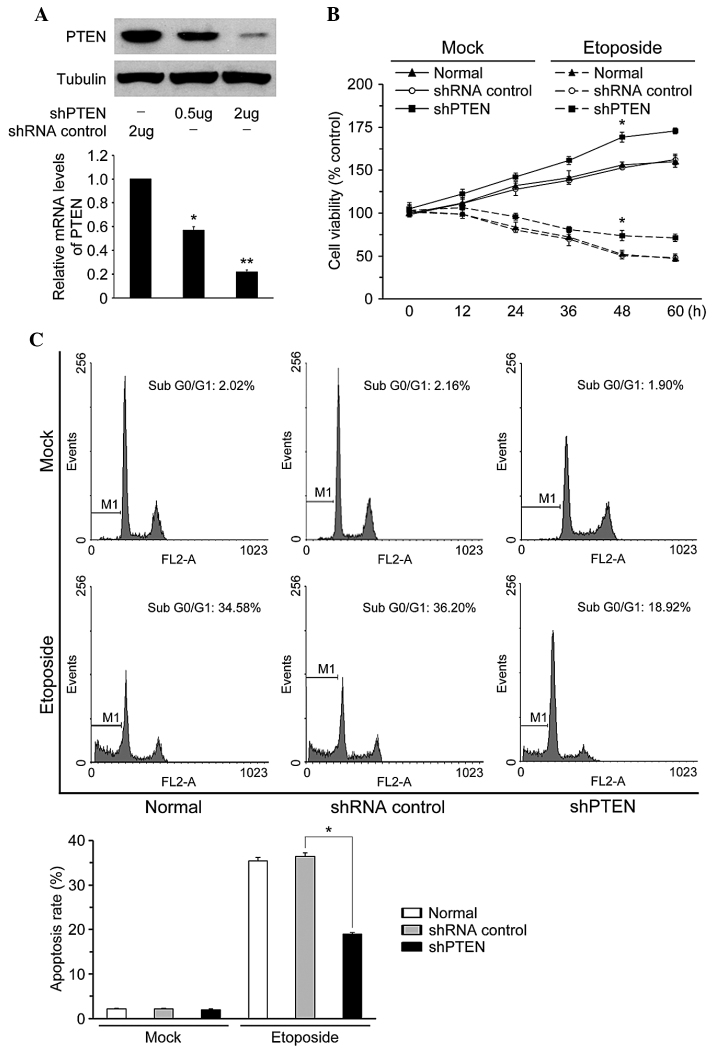
Figure 2.
Effects of knockdown of PTEN on etoposide-induced DNA damage response and cell growth inhibition. (A) Expression levels of PTEN after stable shRNA silencing in ACHN cells. (B) PTEN knockdown increased the viability of ACHN cells upon treatment with or without 30 µM etoposide for 24 h. (C) PTEN silencing inhibited etoposide-induced cell cycle arrest and apoptosis in ACHN cells. The bar graph shows apoptotic rates of cells following PTEN silencing in the presence or absence of etoposide. Corresponding cell cycle phase distributions are shown in the top panel. (*P<0.05, **P<0.01) shRNA, small hairpin RNA; PTEN, phosphatase and tensin homolog.

