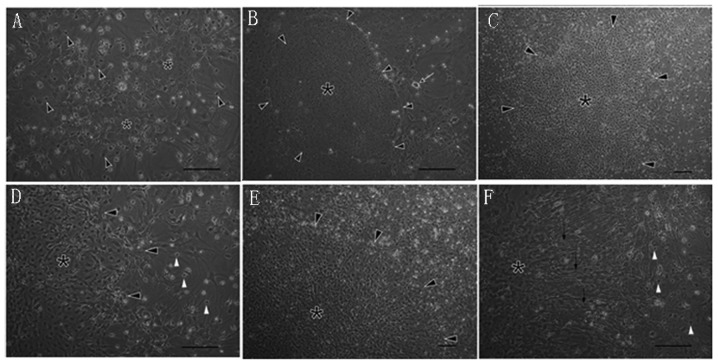
Figure 1.
Different cortical glial cell growth patterns coexist in the same culture. (A) Typical growth pattern with two cell layers. Arrows indicate the small dark, process-bearing top layer cells and stars indicate the light, flat, fibroblast-like bed layer cells. (B) Atypical pattern. The star indicates a round cobblestone-like high compact atypical growth pattern and arrowheads indicate the boundary between the typical and atypical pattern. The arrow indicates one dorsal root ganglia neuron with an extending axon. (C and D) Atypical pattern. The star indicates an irregular high density atypical pattern and arrowheads indicate the boundary between atypical and typical growth patterns. (D) White arrowheads indicate the small dark cells on the typical astrocyte growth pattern, which are absent from the atypical pattern. (E and F) Third atypical pattern. The star indicates the polarized arranged atypical growth pattern. Arrowheads indicate the boundary between the typical and atypical growth patterns. Black arrows indicate the radially oriented astrocytes and white arrowheads indicate the small dark cells on the typical pattern, which are absent from the atypical pattern. Scale bar, 100 µm. All atypical patterns are composed of 100–1,000 clustered cells with a similar morphology.

