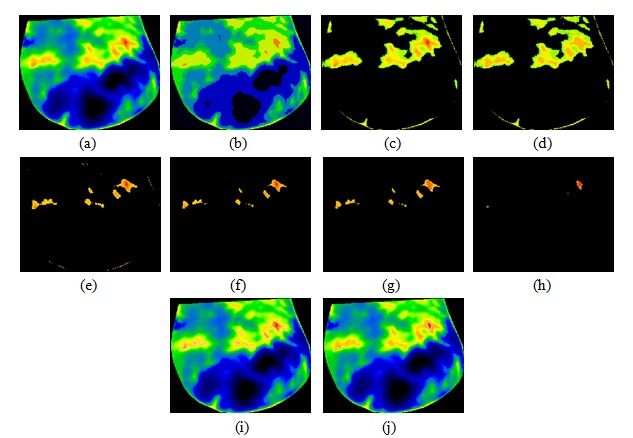
Figure 7. Thermogram of a breast cancer patient 3: (a) cropped breast, (b) result of first iteration of minimum variance quantization, (c) hot region extracted after first iteration, (d) results of second iteration of minimum variance quantization, (e) hot region with undesirable objects extracted after second iteration (f) isolated first and second hottest regions after applying erosion operator, (g) result of third iteration of minimum variance quantization, (h) isolated first hottest region, (i) first and second hottest regions outlined on the original thermogram, (j) first hottest region outlined on the original thermogram.

