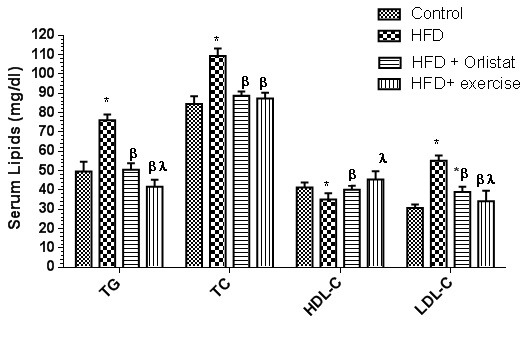
Figure 3. Serum levels of total triglycerides (TG), total cholesterol (TC), high density lipoprotein cholesterol (HDL-C) and low density lipoprotein cholesterol (LDL-C) in the control and the experimental groups of rats. Values are expressed as Mean ± SD for 10 rats in each group. Values were considered significantly different at P < 0.05. *: Significantly different when compared to control group I. ß: significantly different when compared to HFD obese group. *: significantly different when compared to HFD + Orlistat group.