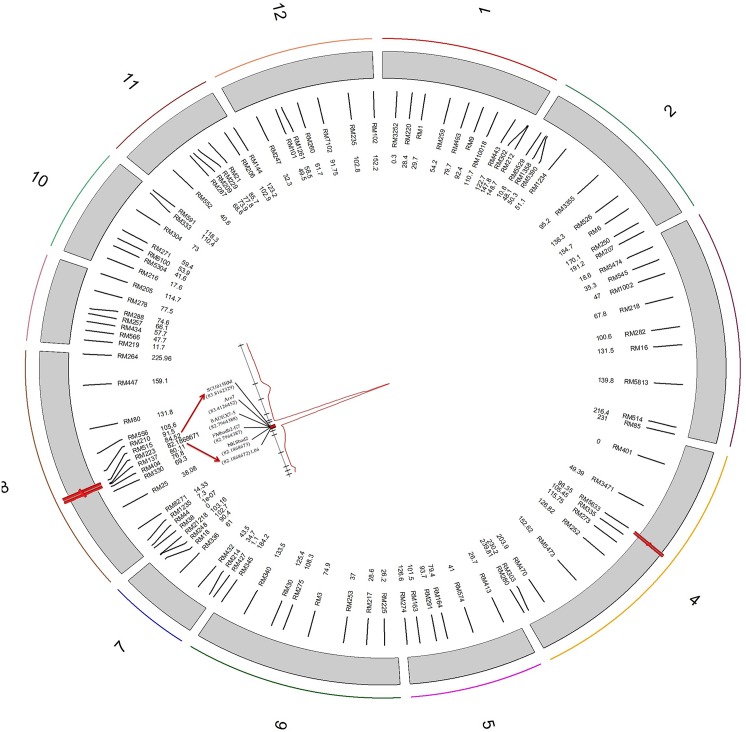
Fig 3. Genetic map of the 12 chromosomes of a rice F2 population (MR84×MRQ74).
Red shapes, on the linkage groups, represent QTL hotspots for the aroma trait. Chromosome numbers are indicated around the circle. The marker names and their genetic positions (cM) are shown to the right of each linkage map inside the circle. Further, LOD curve of the major QTL along with the chromosomal positions (cM) of gene-based primers are indicated on chromosome 8. Also, a red bar on this area shows the Bayesian LOD support interval.

