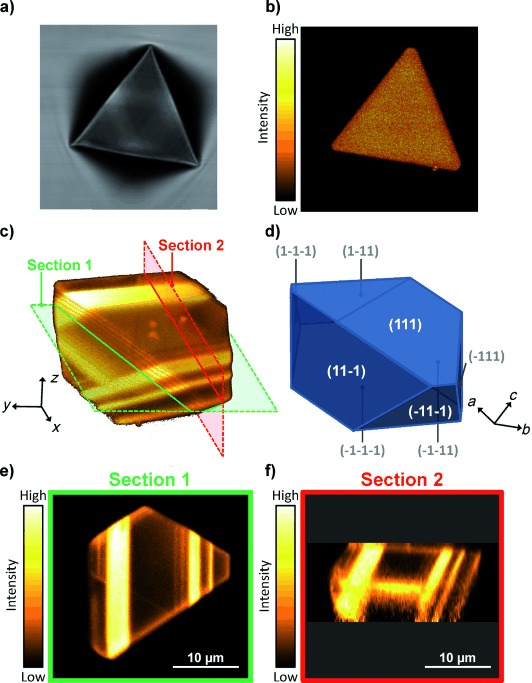
Figure 1.

Confocal fluorescence images of HKUST-1 single crystals demonstrating the introduction of defects upon extending crystallization time. a) Transmission micrograph of a HKUST-1 crystal obtained after a short crystallization time. b) Fluorescence micrograph of the surface of the same crystal illustrating the absence of defects. c) Fluorescence data recorded for a HKUST-1 crystal obtained after extended crystallization time. Semitransparent three-dimensional representation of the fluorescence data obtained as a series of xy-scans along the z-axis. Positions of xy- and xz-sections shown in panels (e) and (f), respectively, are indicated. d) Schematic representation of the single crystal shown in panel (c) with indication of the limiting crystal planes and crystallographic axes. e) As-recorded xy-section. The crystal boundaries in this two-dimensional section are all parallel to the 〈110〉 directions. d) xz-section reconstructed from the data shown in panel (c) and visualizing the angles between the crystal’s exterior surface and defect planes propagating in the crystal’s interior.
