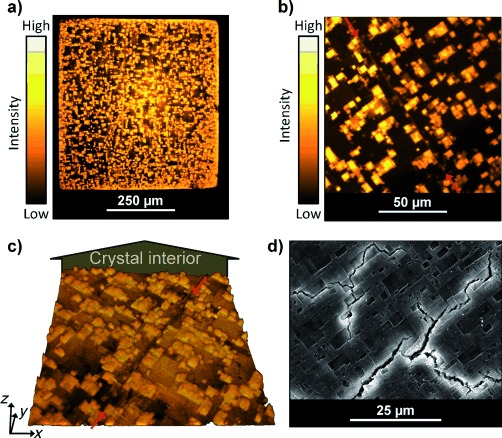
Figure 4.

Confocal fluorescence imaging of defects in a MOF-5 single crystal. a) Overview fluorescence micrograph of the outer surface of a large cubic MOF-5 crystal. b) More detailed fluorescence micrograph of the crystal facet shown in panel (a). The red arrows indicate a line defect. c) Three-dimensional representation of the fluorescence data presented in panel (b), illustrating the penetration of defects into the crystal interior. For easy comparison, the same line defect as in panel (b) is indicated with red arrows. Note that in this representation the outer crystal surface is viewed from inside the crystal for optimal visualization of defect penetration. d) Electron micrograph of a similar MOF-5 crystal illustrating the large irregular cracks formed upon drying.
