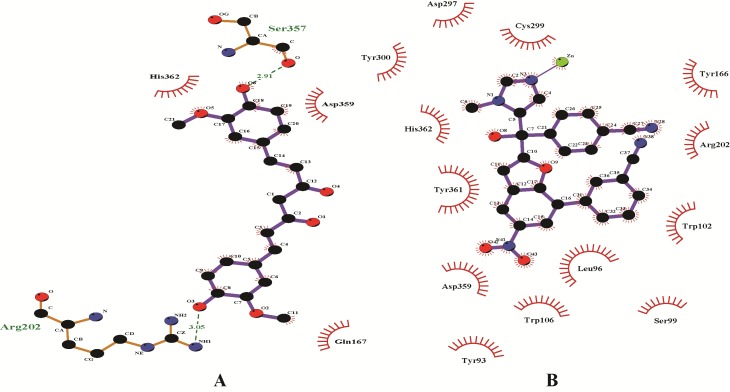
Figure 3.
Interaction diagrams of FTase1 with A) Curcumin and B) BNE. Hydrogen bonds between the enzyme-inhibitor complex is shown as green dashed lines. Other amino acids shown here form the binding pocket which may interact with the inhibitors through non-covalent interactions other than hydrogen bonding.

