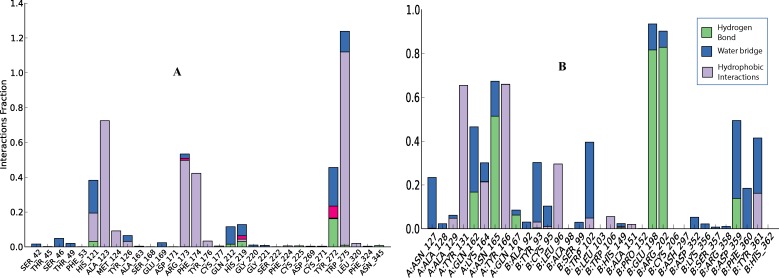
Figure 5.
Amino acid residues that interacted non-covalently with the inhibitor during the simulation period. Values on yaxes represent the percentage of time the inhibitor interacted with that amino acids. This percentage can be more than 100% due to the multiple interactions. A. Interaction of curcumin with GGTase1. W275 is shown to have hydrophobic interactions with curcumin almost throughout the simulation period. B. Interaction of curcumin with FTase. Both the A chain and B chain interact with curcumin. E198 and R202 of the B chain form hydrogen bond with curcumin for more than 80% of the simulation time.

