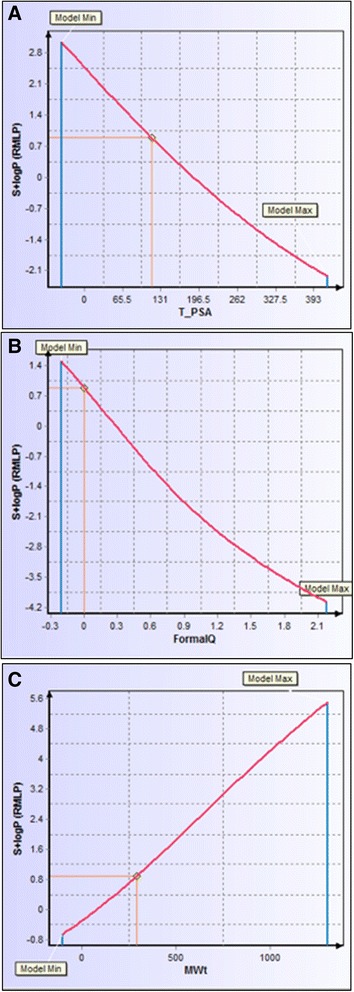
Fig. 14.

Descriptor sensitivity analysis of logP in response to three most influential descriptors. All three graphs chart the sensitivity of S + logP to a unique descriptor. a Response of model to TPSA. Lowering the topological polar surface area of FC101a to approximately 100 would increase S + logP to1.0. b Response of model to formal electric charge. FC101a charge is 0, slightly lowering this charge would increase S + logP. c Response of model to molecular weight. Increasing MW would raise S + logP
