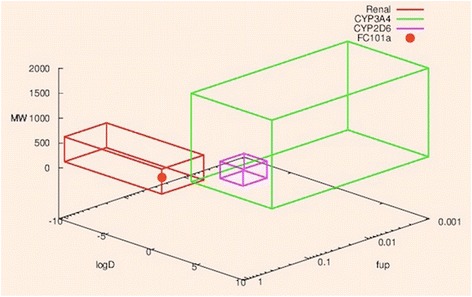
Fig. 15.

Three-dimensional graph depicting possible FC101a clearance pathway. Three-dimensional graph depicts FC101a clearance pathway (red dot) in relation to boundaries of three clinically significant clearance pathways- pathways were determined by Kusama et al. (2010). Red box indicates cluster of drugs undergoing renal clearance, green box indicates cluster of drugs undergoing CYP3A4 metabolism, and purple box indicates cluster of drugs undergoing CYP2D6 metabolism. Graph was generated at: http://www.bi.cs.titech.ac.jp/CPathPred/pred/rect.html
