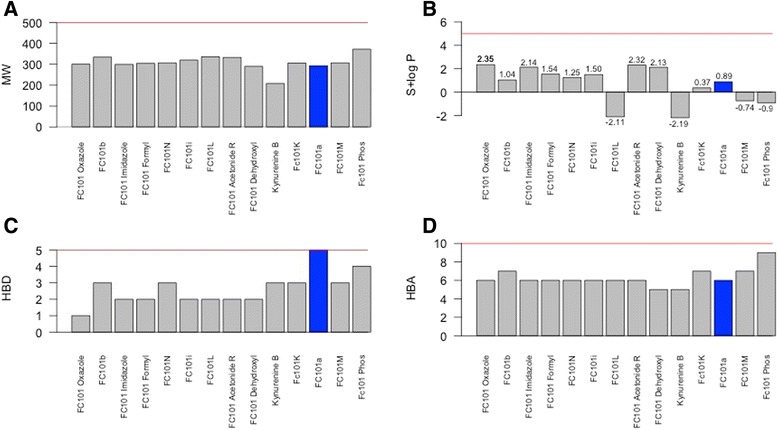
Fig. 6.

Bar graph summarizing properties of FC101a and SA in relation to Lipinski’s RO5. Bar graphs displays the distribution of properties related to Lipinski’s RO5. RO5 is perhaps the most used computational filter in drug candidate screening. Only 8.3 % of drugs within the focused WDI violated more than one of Lipinski’s rules (Lipinski et al. 1997). a MW, b S+ logP, c HBD, d HBA. All properties meet Lipinski’s RO5, denoted by the red line. FC101a is highlighted in blue
